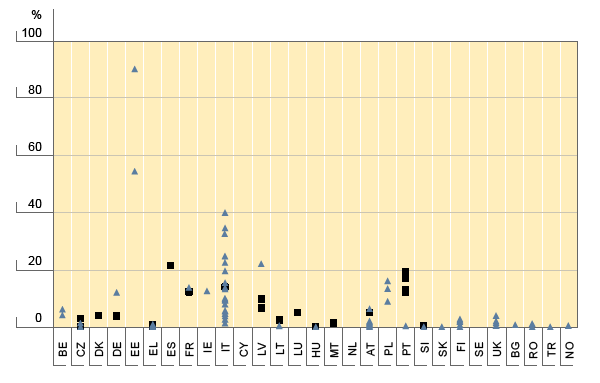
Figure INF-3: HIV prevalence among injecting drug users – studies with national and sub-national coverage – Part (i) All injecting drug users, 2003 to 2004

Notes:
Black square = samples with national coverage; blue triangle = samples with subnational (including local or regional) coverage.
Differences between countries have to be interpreted with caution owing to different types of settings and/or study methods; national sampling strategies vary.
Data for Portugal and Italy and part of the data for Czech Republic and France include non-IDUs and therefore may underestimate prevalence among IDUs (estimated proportion of non-IDUs in the samples: Italy 5-10 %, Czech Republic, France and Portugal not known).
Data for Belgium, Italy, Portugal and Slovakia are limited to prevalence among IDUs in treatment and may not be representative of prevalence among IDUs who are not in treatment. In addition, data may not be representative for people who are in treatment - this is known to be the case for Belgium.
Data for Luxembourg and France, and part of the data for Czech Republic, are based on self-reported test results, which are less reliable than clinically documented tests. Data for Estonia is from 2005 (see sources).
See also 'General notes for interpreting data' on the Explanatory notes and help page.
Sources:
Reitox national focal points. For primary sources, study details and data before 2003, see Table INF-8. For Estonian data see reference 4 in the Table INF-0.