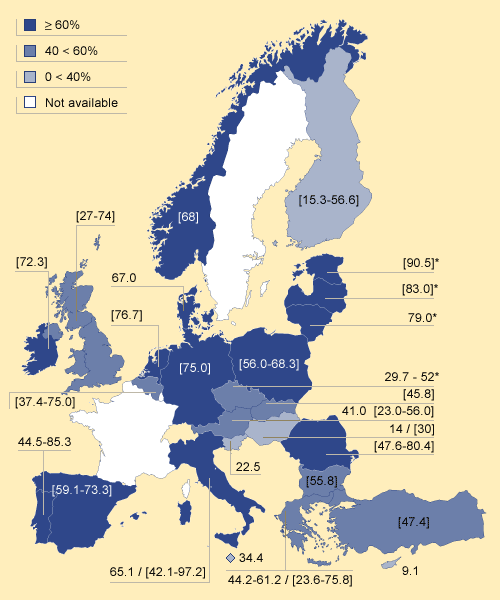
Figure INF-6: Estimated HCV antibody prevalence among injecting drug users – studies with national and sub-national coverage – Part (iv) All injecting drug users – map of EU, 2003 to 2004

Notes:
Figures in [brackets] are local data. Colour indicates midpoint of national data, or if not available, of local data.
Data for Italy and Portugal include non-injectors and are likely to underestimate prevalence in injectors
* Data in part or totally before 2003 (Czech Republic 2002-03; Estonia 2002; Latvia 2001; Lithuania 2000).
See also 'General notes for interpreting data' on the Explanatory notes and help page.
Sources:
Reitox national focal points. For primary sources, study details and data before 2003, see Table INF-11.